DEFRA emission factors 2026 — what actually changed
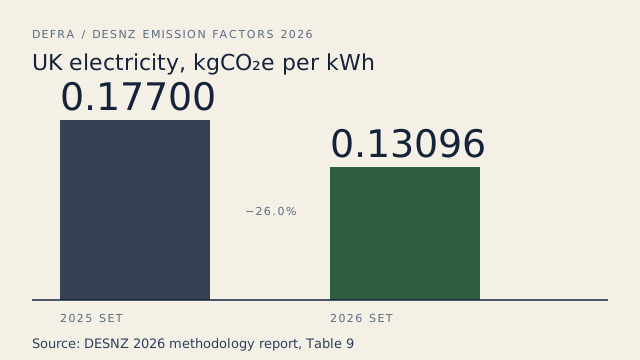
The UK grid-average electricity factor fell from 0.17700 to 0.13096 kgCO2e per kWh.
Almost every write-up of that fall attributes it to the wrong thing. DESNZ published its own split, and most of the drop is real grid decarbonisation — not the methodology change.
This page carries the three-way decomposition, the file that was quietly withdrawn, the data year that is now missing from the published series, and a worksheet-by- worksheet answer to the question everyone actually has: which tab do I use.
Three things changed, not one
A conversion factor update is normally a new column of numbers in the same workbook. The 2026 set is not that.
Three separate things changed underneath it, and each one breaks something that used to work.
The file changed
The condensed set no longer exists. DESNZ published it every year until 2025 and stopped in 2026, and the methodology report says so in a single line that almost nobody has read. DESNZ, Conversion factors 2026
Pages across the UK carbon-reporting web still instruct readers to download it.
The number changed
UK electricity fell about 26%, transmission and distribution losses about 30%, and every factor derived from electricity moved with them — electric vehicles, rail, homeworking, managed assets. Major changes report 2026
The series changed
This is the one with consequences that outlast the reporting year.
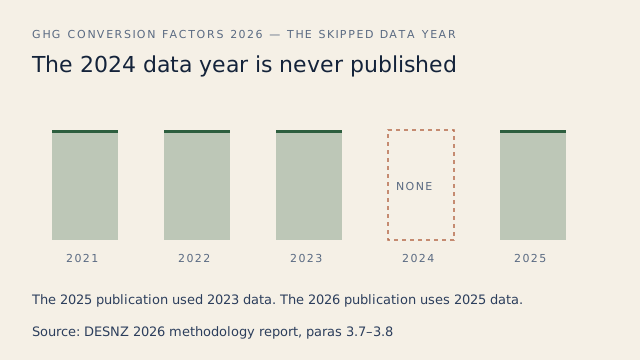
DESNZ cut the data lag from two years to one, and in doing so skipped a data year entirely.
The 2025 publication used 2023 data; the 2026 publication uses 2025 data. There is no published factor built on 2024.
What the UK conversion factors are, and who publishes them
Most people searching for these call them the DEFRA factors. That name is about a decade out of date, and it matters more than it sounds.
The UK government conversion factors for company reporting of greenhouse gas emissions are published annually by the Department for Energy Security and Net Zero. GOV.UK collection
They were badged under DEFRA historically, then BEIS, and now DESNZ — which is why searches for “DEFRA emission factors”, “BEIS emission factors” and “DESNZ conversion factors” are all looking for the same spreadsheet.
Why the naming confusion is a real trap
DEFRA still publishes a different emissions dataset, and it is easy to download the wrong one.
DESNZ flags this on the publication page itself: these conversion factors are not the spend-based emissions multipliers DEFRA publishes alongside the UK and England carbon footprint statistics. UK carbon footprint
One is activity-based — kilowatt-hours, litres, kilometres. The other is spend-based — pounds spent per category.
They are not interchangeable, and mixing them inside one inventory produces a number that means nothing.
Who actually builds them
The factors are compiled by Aether Ltd as part of the National Atmospheric Emissions Inventory contract, subcontracted from Ricardo, now part of WSP. NAEI
The 2026 release also carries a statement of voluntary compliance with the Code of Practice for Statistics, which is where the governance detail sits — including that the steering group meets twice a year and that there is no pre-announced release date. Code of Practice statement
They are free, they are Open Government Licence, and they are suitable for UK organisations of any size as well as international organisations reporting their UK operations. OGL v3.0
The −26%, in the actual figures
The headline is a percentage, and a percentage is not something you can put in a report. These are the numbers underneath it.
The UK grid-average electricity generation factor — the one you use for location-based Scope 2 — moved as follows. Methodology report 2026, Table 9
| Line item | 2025 set | 2026 set | Change |
|---|---|---|---|
| Electricity generated (Scope 2, location-based) | 0.17700 | 0.13096 | −26.0% |
| Transmission & distribution losses (Scope 3) | 0.01853 | 0.01299 | −29.9% |
| Electricity consumed, including losses | 0.19553 | 0.14395 | −26.4% |
Pair −26% with the generation figure, and nothing else
There is a trap in that table, and it has caught people already.
The −26% headline belongs to the generation row, on its own.
DESNZ reports transmission and distribution separately at about −30%, so a reader who sees “−26%” next to a figure that already includes losses will try to reconcile two numbers that were never meant to add up.
If you are quoting the fall, quote 0.17700 to 0.13096 alongside it.
What the change does to your own electricity figure
Enter your annual electricity consumption. The result is computed from the two published factors above — nothing is estimated.
What actually caused the fall — DESNZ’s own split
This is where most coverage of the 2026 update goes wrong, and it goes wrong in both directions.
One camp reports the fall as pure grid decarbonisation, which overstates the achievement. The other reports it as mostly a methodology artefact, which understates it.
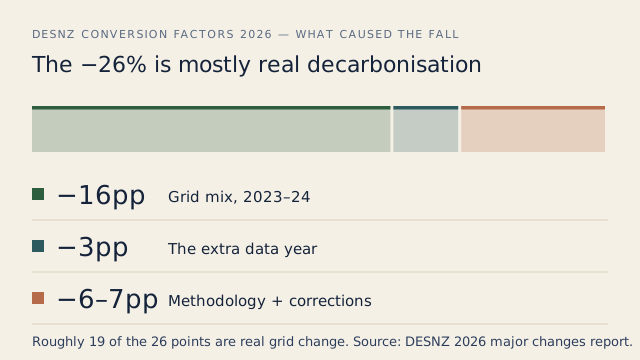
DESNZ published the decomposition. It is in the major changes report, and it settles the argument. Major changes report 2026
Reading the split honestly
Roughly nineteen of the twenty-six percentage points are real changes in what the grid was burning.
Six or seven points are methodological: a better treatment of electricity imports and exports, and a correction to a small double-counting problem that affected autogenerators.
So the honest sentence is that the UK electricity factor fell mostly because the grid got cleaner over two years, with a methodology change contributing roughly a quarter of the move.
Not “the grid decarbonised 26% in a year”, which is false because the fall spans two years of grid mix.
And not “it is mostly a methodology change”, which is false because DESNZ says methodology accounts for six or seven points out of twenty-six.
Why the two-year span is the part people miss
The lag change is what makes this comparison unusual.
Because the 2025 set was built on 2023 data and the 2026 set is built on 2025 data, the published year-on-year change contains two years of grid movement, not one. Major changes report 2026
That is the single sentence to put in a footnote if you present a 2025-to-2026 electricity comparison to a board, an auditor or an investor.
The 2024 data year that is never published
Cutting the lag from two years to one did not compress the series. It punched a hole in it.
The 2025 publication was built on 2023 data. The 2026 publication is built on 2025 data.
No published conversion factor set has ever been built on 2024 UK electricity data.
DESNZ names this directly, calling it a “skipping” of the 2024 data on UK electricity emissions intensity, and says it should be clearly explained for transparency. Methodology report 2026
Who this actually affects
If you report a single year in isolation, it does not affect you at all.
It affects anyone whose reporting spans the gap: a three-year trend chart, an intensity ratio tracked over time, a science-based target with a base year before 2024, or a SECR Directors’ Report that shows the prior year alongside the current one.
In each of those cases the published series has a step in it that is partly a real change in the grid and partly an artefact of which data year DESNZ happened to use.
The fix DESNZ provides, and almost nobody mentions
There is a remedy, and it is in the methodology report rather than the workbook, which is probably why it has gone unnoticed.
Appendix 2 publishes a full recalculated time series for electricity and for heat and steam, computed consistently on the most recent data for every year. Methodology report 2026, Appendix 2
DESNZ describes it as provided for users seeking a fully consistent data time series.
It is not the set of published conversion factors, and it does not replace them for the reporting year itself.
But if you need a defensible trend line across the gap, it is the document to use — and citing it is a stronger answer to an auditor than a footnote apologising for the break.
Should you restate your prior years?
DESNZ does not tell you. It says explicitly that this is your decision, taken by reference to whichever reporting standard you are following.
Its wording is worth reading carefully: users will need to decide whether to adjust previous years’ estimates to use the new factors so that they have a consistent time series, and this is a recommendation or requirement under some GHG reporting standards. Methodology report 2026
So the answer depends on which regime is asking, and the four that matter to a UK filer do not all answer the same way.
What each regime expects of a methodology change
Qualitative by design. There is no score here, because the honest answer is a reading of each framework’s own recalculation language.
The four answers, as served text
The same content as the instrument above, in HTML, for the same reason the worksheet map is repeated further down: an answer that only exists in a client-rendered panel is an answer this page cannot be cited for.
| Regime | Does it require restatement? | What it does require |
|---|---|---|
| SECR | No, and it does not forbid it | A statement of the methodology used, alongside the prior-year comparative and the intensity ratio |
| GHG Protocol base year | Yes, where significant against your own threshold | A published base-year recalculation policy, applied consistently to methodology changes and data-accuracy improvements |
| UK SRS S2 | Follows the GHG Protocol position | Location-based Scope 2 is mandatory; market-based is permitted, not required — only the location-based figure moves with the DESNZ change |
| CDP | Either answer is accepted | An explicit statement of whether figures were restated, why, and against what threshold |
The practical shape of the decision
For most UK filers the question resolves on one point: whether electricity is a large enough share of the inventory to breach the significance threshold in their own base-year recalculation policy.
An office-based services business, where purchased electricity dominates Scope 1 and 2, will usually find that it does.
A manufacturer whose emissions are dominated by process heat and fleet fuel will usually find that it does not, even though the electricity line itself moved by a quarter.
The test is the threshold you already published, applied as written — not a fresh judgement about whether this particular change feels material this year.
If you do restate
Restate the whole series on a consistent basis rather than adjusting one prior year, and say which source you used to do it.
Appendix 2 of the methodology report is the obvious source, because it is DESNZ’s own recalculation on the current method for every year. Methodology report 2026, Appendix 2
Restating on a mixture of published sets and back-cast figures produces a series that cannot be reproduced by anyone checking it, which is worse than not restating at all.
The one thing that is not optional
Whether or not you restate, disclose which factor set each year used.
A single line naming the publication year of the factors applied to each reporting year removes the entire ambiguity, and it costs one row in a methodology note.
The failure mode this prevents is specific and common: a reader sees emissions fall, attributes it to management action, and the organisation quietly takes credit for a statistical revision.
The condensed set has been withdrawn
Until 2025, DESNZ published three spreadsheets. The condensed set was the one it recommended for most users and for all new users.
It is not in the 2026 release.
The methodology report records the change in a single sentence: as of 2026, the condensed set is no longer published. Methodology report 2026
DESNZ gives no stated reason, and the full set has been relabelled from “for advanced users” to “for all users” to absorb the role.
What the 2026 release actually contains
- Conversion factors 2026: full set (for all users) — the workbook. New users are now directed to its ‘Introduction’ worksheet, which is where the condensed set’s guidance went.
- Flat file (for automatic processing only) — one row per factor, for ingestion into a carbon accounting system.
- Methodology report — 152 pages, and the source of almost everything on this page that competitors do not carry.
- Major changes report — 18 pages, a row-by-row list of what moved and why. If you read one document, read this one.
- Statement of voluntary compliance with the Code of Practice for Statistics — governance, authorship and release practice.
If a page, a supplier or an internal procedure tells you to download the condensed set, it is describing the 2025 release. DESNZ, Conversion factors 2026
The flat file was wrong for seven weeks
This one has a deadline attached, and it is the reason to check a pipeline rather than assume it.
On 31 July 2026, DESNZ reissued the flat file to correct a number of values that had been published as zero. DESNZ update log, 31 July 2026
The file is now titled “flat file (for automatic processing only) — updated July 2026”.
What to do about it
Anyone who ingested the flat file between 11 June and 31 July 2026 has zeros where factors should be.
A zero factor does not throw an error. It silently produces zero emissions for whatever activity it covers, which is the worst possible failure mode in a carbon inventory because nothing downstream flags it.
If you or your software vendor loaded the 2026 flat file before 31 July, re-ingest it and re-run anything computed from it.
Only the flat file was reissued. The full set, the methodology report and the major changes report were not revised.
Which year’s conversion factors to use
The single most common error in UK carbon reporting is using the wrong year-set, and it has become more expensive in 2026 than it has ever been.
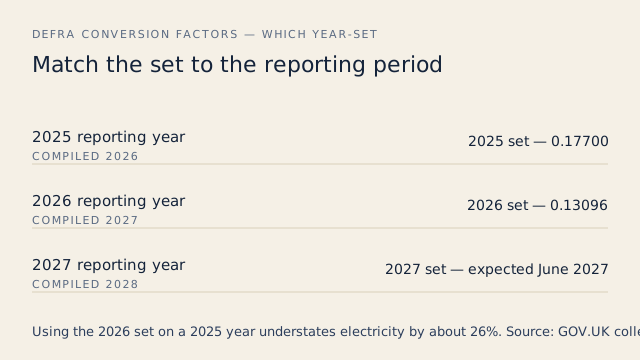
The rule is unchanged: use the factors for the year your reporting period falls in, not the year you compile or submit the report. GOV.UK collection
A 2026 reporting year uses the 2026 factors, even if the report is assembled in 2027.
| Reporting period | Compiled in | Factor set |
|---|---|---|
| 2025 reporting year | 2026 | 2025 set — electricity 0.17700 |
| 2026 reporting year | 2027 | 2026 set — electricity 0.13096 |
| 2027 reporting year | 2028 | 2027 set, expected June 2027 |
Why the stakes rose this year
In a normal year, reaching for the wrong set moves your electricity number by a percent or two and nobody notices.
In 2026, reaching for the wrong set moves it by a quarter.
A company that applies the 2026 factors to its 2025 reporting year will understate its electricity emissions by roughly 26%, and the error is large enough to change an intensity ratio, a target trajectory and a year-on-year narrative all at once.
Every year-set stays available — deliberately
DESNZ keeps every annual publication back to 2002 in one collection, and that is not an archive habit. Annual collection, 2002–2026
It exists so a prior year can be reported on its own factors rather than having the newest figures forced onto it.
Bookmark the collection, not a single year’s publication page.
When one report spans several years — a trend, a base-year comparison — each year is converted on its own set, and the 2026 methodology break is footnoted where the series crosses it.
When the 2027 set is due
DESNZ states that the next publication is expected in June 2027. Methodology report 2026
There is no pre-announced release date. The Code of Practice statement says only that the factors are regularly published in the first half of June, and the recent record bears that out — 10 June 2025, 11 June 2026, with July 2024 the outlier. Code of Practice statement
How a conversion factor is applied
Every emissions calculation on the planet reduces to the same line: activity data multiplied by the matching factor gives tonnes of CO2 equivalent.
Activity data is whatever you can evidence from invoices, meter reads and records — kilowatt-hours of electricity, kilowatt-hours or cubic metres of gas, litres of fuel, kilometres travelled, tonne-kilometres freighted.
The factor turns each unit into emissions. Environmental Reporting Guidelines
All of the difficulty is in the matching, and the matching has to be right on four fronts at once.
| Match on | What goes wrong if you don’t |
|---|---|
| The activity or fuel | A generic ‘diesel’ factor applied to a specific blend, or an average car factor applied to a known fleet |
| The unit | Litres against a per-kWh factor, or km against a tonne.km factor — usually an order of magnitude out |
| The energy basis | Net calorific value against a bill stated on gross — a quiet ~10% error on gas |
| The reporting year | In 2026 specifically, a ~26% error on electricity |
Which worksheet do I use?
The full set runs to around thirty worksheets. The published guidance explains what each one contains, but not which one your activity belongs in.
That gap is where most of the real-world error sits, because several worksheets look like they cover the same thing and adding two of them together double-counts.
Electricity is the worst case: UK electricity, Transmission and distribution, WTT–UK electricity, UK electricity for EVs and UK electricity T&D for EVs are five different worksheets, and a single kilowatt-hour belongs in some combination of them depending on what consumed it and which scope you are filling in.
Route an activity to its worksheet
Pick what you are converting. Every worksheet name, scope allocation and 2026 movement below is taken from the DESNZ workbook and the major changes report.
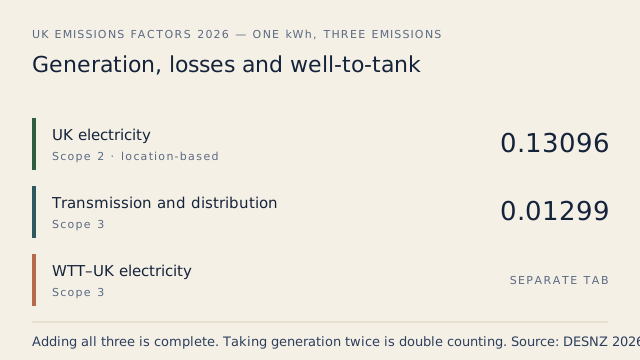
The double-counting rule, stated once
Generation, transmission losses and well-to-tank are three different emissions, not three versions of one.
Generation is your Scope 2. Transmission and distribution losses are Scope 3. Well-to-tank is also Scope 3, and it covers the extraction, refining and delivery of the fuel before it ever reached the power station.
Reporting all three is complete. Reporting generation twice, once from the electricity tab and once from the EV tab for the same kilowatt-hour, is double counting.
The worksheet map, in full
The router above is convenient. This table is the same information as served HTML, because a fact that exists only inside a client-rendered component is a fact this page cannot be cited for.
| Activity | DESNZ worksheet | Scope | 2026 movement |
|---|---|---|---|
| Grid electricity | UK electricity | Scope 2, location-based | −26% |
| Network losses on that electricity | Transmission and distribution | Scope 3 | −30% |
| Upstream of that electricity | WTT–UK electricity | Scope 3 | −20% generation, −10% T&D |
| Natural gas | Fuels | Scope 1 | No major changes |
| Fleet fuel, owned vehicles | Fuels, or Passenger / Delivery vehicles | Scope 1 | Varies by segment |
| Electric and plug-in hybrid vehicles | UK electricity for EVs; UK electricity T&D for EVs | Scope 1, 2 and 3 | −23% to −37%, some PHEV segments up |
| Rail and public transport | Business travel–land | Scope 3, cat. 6 | International rail +154%; LU −44% |
| Air travel | Business travel–air | Scope 3, cat. 6 | No major changes |
| Freight | Freighting goods | Scope 3, cat. 4 or 9 | Rigid HGV +18%; artic −6.2% |
| Homeworking | Homeworking | Scope 3, cat. 7 | Office equipment −31% |
| Refrigerant loss | Refrigerant & other | Scope 1 | R-511A corrected to zero |
| Water and waste | Water supply; Water treatment; Waste disposal | Scope 3, cat. 5 and 1 | No major changes |
Reading the map when two worksheets look interchangeable
Three pairs cause almost all the confusion, and each has a rule that resolves it.
Fuels against vehicle worksheets. Use the fuel worksheet when you have litres, and the vehicle worksheet when you only have distance.
Litres is the better evidence, because it comes from a fuel card or an invoice rather than from an assumption about consumption per kilometre.
Passenger vehicles against business travel by land. The first is for vehicles you own or control; the second is for journeys your people take in vehicles you do not.
A grey-fleet mile in an employee’s own car sits in business travel, not in the fleet line, even though the vehicle type may be identical.
Delivery vehicles against freighting goods. The first is per kilometre and per vehicle; the second is per tonne-kilometre and per consignment.
If you know what was carried and how far, freighting goods is the more accurate line. If you only know that a van did a round, the delivery vehicle line is the honest one.
Where the workbook cannot help you
Two common activities have no worksheet at all, and looking harder will not find them.
There is no factor for purchased goods and services by category, because that is a spend-based question and this is an activity-based dataset — DEFRA’s separate multipliers are the tool for it. UK carbon footprint
And there is no factor for electricity consumed outside the UK, which is the limit discussed further down this page.
Gross versus net calorific value
This one produces an error of roughly a tenth on gas, and it produces it silently, in the right order of magnitude, on a plausible-looking number.
UK gas bills state energy on a gross calorific value basis, and the DESNZ workbook publishes both gross and net CV figures side by side.
Take the net figure against a gross-basis bill and everything still looks normal. Nothing validates, nothing warns, and the result is wrong by about the difference between the two bases.
The rule is simply to match the basis your data arrived in, which for UK metered gas is almost always gross. Methodology report 2026
Location-based versus market-based Scope 2
Purchased electricity is the most misreported line in a UK inventory, because there are two legitimate methods and they answer different questions. GHG Protocol Scope 2 Guidance
The location-based method uses the average emissions intensity of the grid where the electricity was consumed.
For UK consumption that is the DESNZ grid-average factor — 0.13096 kgCO2e per kWh in the 2026 set.
The market-based method reflects the electricity you contracted for, using factors derived from contractual instruments: renewable supply agreements, REGO-backed tariffs, or the residual mix where no specific contract applies.
DESNZ does not publish a market-based factor
This is worth stating plainly, because people go looking for it in the workbook.
The conversion factors are a grid-average dataset. Market-based factors come from your supplier’s own disclosure or from a residual-mix publication, not from DESNZ.
Dual reporting is not optional
The GHG Protocol Scope 2 Guidance requires companies operating in markets that offer contractual instruments to report both figures. Scope 2 Guidance
The UK is such a market, so a UK inventory that reports only one of them is incomplete.
The two exist to be read together: one shows the grid you actually drew from, the other shows the procurement choices you made.
Blending them, or reporting the lower of the two as “our Scope 2”, is the error that assurance providers look for first.
The live grid number is not your factor
NESO publishes half-hourly carbon intensity for the GB electricity system, and it is a genuinely useful operational signal. NESO data portal
It is not a substitute for the annual DESNZ factor in a compliance calculation, and the two will never agree, because one is a real-time instantaneous figure and the other is an annual average now running about a year behind.
The relationship between them is set out on our UK grid carbon intensity page.
Transmission losses and well-to-tank
Both moved in 2026, by different amounts and for different reasons, and both are routinely left out of UK inventories altogether.
Transmission and distribution, −30%
T&D losses fell from 0.01853 to 0.01299 kgCO2e per kWh, a fall of about 30% — steeper than generation itself. Major changes report 2026
These are the emissions from electricity lost in the network between the power station and your meter, and they belong in Scope 3 category 3.
They fell faster than generation because the loss factor scales with the generation intensity and the loss percentage moved as well.
Well-to-tank electricity, −20% — with a caveat
The WTT factors for UK electricity generation fell about 20%, and WTT for transmission and distribution about 10%. Major changes report 2026
The caveat matters more than the numbers: DESNZ notes these had not been updated since the 2023 publication, and that the underlying WTT values for fuels were not refreshed in this cycle either.
So the WTT electricity move is three years of catch-up arriving at once, on top of a set of fuel WTT values that are themselves several years old.
That is a legitimate limitation to note in a methodology statement, and it is the kind of thing an assurance provider will ask about if your WTT line moves sharply without explanation.
Business travel by land was rebuilt, not adjusted
Electricity got the headlines. The land travel factors got the larger percentage moves, and almost nobody has reported them.
DESNZ replaced passenger-kilometre and fleet-composition assumptions that had not been revisited since 2021 — which meant they were built on pre-pandemic travel patterns. Major changes report 2026
| Mode | 2026 change | Why |
|---|---|---|
| International rail | +154% to +156% | Passenger.km and fleet data updated from 2021 estimates built on pre-COVID figures |
| Coach | +42% to +43% | New data from a large operator replaced assumptions implying unrealistic occupancy |
| National rail | −13% | Same data refresh, opposite direction |
| London Underground | −44% to −45% | Updated TfL data and the electricity factor change combined |
| Light rail and tram | −26% | Tracks the electricity factor |
What to expect in your own numbers
An organisation with a European travel programme built on rail rather than flights may find its reported travel emissions rise in 2026 while its actual travel falls.
That is a genuinely awkward disclosure, and the defence is the same as everywhere else on this page: name the factor set, name the revision, and let the underlying activity data carry the story.
Electric and plug-in hybrid vehicles
A plug-in hybrid touches Scope 1, Scope 2 and Scope 3 at the same time, which is why it generates more questions than any other line in the set.
The petrol or diesel it burns is Scope 1 if you own or lease the vehicle. The electricity it draws is Scope 2 when charged at your own site. Transmission losses and well-to-tank on both are Scope 3.
Charging at a public charger or an employee’s home moves the electricity out of your Scope 2 and into Scope 3, because you are not the one buying it.
What changed in 2026
The EV-related factors moved with electricity, and by varying amounts: UK electricity for EVs fell roughly 23% to 37% across car and van segments, and the EV transmission and distribution factors fell roughly 25% to 40%. Major changes report 2026
Some plug-in hybrid segments moved against the trend, because the newly registered models in that segment were less efficient than the ones they replaced — sports PHEVs rose about 9.5%, and Class III and average PHEV vans rose about 16%.
MPV battery-electric and plug-in hybrid factors fell around 36% to 37%, which DESNZ attributes to newer models being substantially more efficient and more numerous.
The direction of travel is not uniform, so a fleet with a mixed profile should expect its per-vehicle factors to move in both directions at once.
Homeworking fell 31%
The homeworking office-equipment factor had not been updated since 2022.
Its 31% fall is therefore several years of grid decarbonisation arriving together, plus the 2026 electricity methodology change. Major changes report 2026
For an organisation with a large hybrid workforce this is a material Scope 3 movement that has nothing to do with any change in how or where people work.
It is worth calling out separately in a disclosure rather than letting it disappear into a Scope 3 total, precisely because it looks like a behavioural win and is not one.
Heavy goods vehicles rose 18%, because of loading
Freight factors are expressed per tonne-kilometre, which means they depend on how full the vehicles are as much as on what they burn.
Rigid HGVs over 7.5 to 17 tonnes, average laden, rose about 18% in both refrigerated and non-refrigerated form, while articulated vehicles at 50% and 100% laden fell about 6%. Major changes report 2026
DESNZ traces the rise to Department for Transport road freight statistics: a fall in percentage loading means fewer goods carried per journey, which raises emissions per tonne of goods moved. DfT road freight statistics
Nothing about the vehicles changed. The economy’s loading behaviour did.
R-511A was wrong, and is now zero
One refrigerant blend had been mis-specified, and the correction takes its Kyoto-gas factor to zero.
R-511A had been calculated as a 95:5 mix of R-290 and HFC-152a. It should have been a 95:5 mix of R-290 and E-170. Major changes report 2026
The Kyoto-products factor accordingly falls from 6.9 to 0 kgCO2e per kg, a change of −100%, with the total including non-Kyoto gases down about 99%.
If you have reported R-511A losses in a prior year, that prior figure was overstated. This is one of the few 2026 changes where restating is straightforwardly the right answer, because it corrects an error rather than reflecting a new measurement.
What did not change — and what is frozen
A major changes report is read for what moved. The more useful half is often what did not, and how long some of it has been standing still.
DESNZ records “no major changes this year” for fuels, bioenergy, heat and steam, water supply and treatment, material use, waste disposal, business travel by air and sea, hotel stays, and outside-of-scopes. Major changes report 2026
The frozen tables, and when they were last touched
Several groups of factors are explicitly held constant from earlier publications, and the methodology report lists them by vintage. Methodology report 2026
- Held from 2025 — heat and steam, aviation, water supply and water treatment, WTT bioenergy, outside of scopes.
- Held from 2024 — WTT passenger vehicles, WTT business travel by land, WTT delivery vehicles and freight.
- Held from 2023 — WTT fuels, WTT electricity, WTT heat and steam, WTT business travel by air, refrigerants.
This is not a criticism of the dataset. It is the practical reality of a free national dataset maintained on an annual cycle with finite resources.
It does mean that a claim of “current published factors” carries different weight depending on which tab it came from, and that is worth knowing before you defend a number in an assurance conversation.
AR5 or AR6 global warming potentials
There is a genuine, unresolved inconsistency here for anyone reporting under both a UK factor set and an international standard.
The DESNZ factors use the IPCC Fifth Assessment Report’s 100-year global warming potentials, because AR5 is the basis currently accepted for UNFCCC reporting. Methodology report 2026
Under AR5, methane is 28 and nitrous oxide is 265.
The Sixth Assessment Report gives different values, and some reporting guidance now points towards AR6. IPCC AR6 Working Group I
You cannot resolve this by mixing them. If your inventory uses DESNZ factors, it uses AR5 GWPs by construction, and the honest disclosure is to say so rather than to imply a choice you did not make.
These are UK factors, and only UK factors
DESNZ publishes a UK grid factor. It does not publish grid factors for other countries, and this catches every UK group with overseas operations.
The publication is scoped to UK-based organisations and to international organisations reporting on their UK operations. GOV.UK collection
Electricity consumed in Germany, the United States or India needs that market’s own grid factor, from a source such as the IEA emission factors dataset, a national inventory or a residual-mix publication. IEA emission factors
Applying the UK grid factor to overseas consumption is a common shortcut in a first inventory, and in 2026 it became a considerably larger error, because the UK grid is now substantially cleaner than most of the grids people apply it to.
The fuel, freight and travel factors travel better than the electricity ones, but the same caution applies: they are built from UK activity data and UK fleet composition.
What to check with your carbon accounting software
Most organisations of any size no longer apply these factors by hand. A platform does it, which moves the risk rather than removing it.
Four questions settle whether a vendor has handled the 2026 release properly, and all four have a right answer.
Which flat file are you on?
If the answer is the version ingested at publication, some values in that pipeline are zeros, because the flat file was reissued on 31 July 2026. DESNZ update log
Ask for the ingestion date, not for a reassurance.
How do you select the year-set?
The right answer is that the factor set is chosen by the reporting period of the data, per record.
The wrong answer, and a surprisingly common one, is that the platform applies the latest published set to everything in the system.
In an ordinary year that produces a small distortion in historic data. In 2026 it silently restates every prior year’s electricity down by about a quarter.
Did the historic series get rewritten?
This follows directly from the previous question, and it is worth asking separately because it is the one with governance consequences.
If prior-year figures in the platform changed when the 2026 factors were loaded, that is a restatement — whether or not anyone decided to make one.
An unannounced restatement inside a system of record is a problem in its own right, before anyone gets to whether the new numbers are better.
Which GWP basis, and which WTT vintage?
A platform blending DESNZ factors with an international database may be mixing AR5 and AR6 global warming potentials in one inventory.
It may also be applying WTT values that DESNZ itself has held constant since 2023, without surfacing that they are frozen.
Neither is wrong, and both need to be disclosed rather than discovered.
What an assurance provider will ask
A 26% fall in a headline number attracts attention, and limited assurance over SECR or UK SRS S2 disclosures is now common enough that the questions are predictable.
Preparing for them is mostly a documentation exercise, and it is much cheaper done before the fieldwork than during it.
Which factor set, evidenced
Expect to show the publication your figures came from, not just to name it.
Keeping the actual workbook alongside the calculation — rather than a link to a GOV.UK page whose contents change annually — is the difference between a five-minute answer and a re-performance.
This is not hypothetical this year: the flat file at that URL on 12 June and the flat file at the same URL on 1 August are different files.
Whether the fall was explained
The question is rarely “is the number right”. It is “does the narrative around the number match what actually happened”.
A disclosure attributing a 26% electricity fall to efficiency measures, where the factor did the work, is a misstatement of the commentary even where the tonnage is arithmetically correct.
Consistency across the series
If prior years were restated, expect to evidence the recalculation policy, the threshold, and the source used for the restated figures.
If they were not, expect to evidence that the decision was taken deliberately against that same policy rather than by default.
Completeness on the Scope 3 electricity lines
Transmission and distribution losses and well-to-tank are the two most commonly omitted lines in a UK inventory, and both moved this year.
An inventory that reports Scope 2 generation and nothing else is incomplete rather than conservative, and 2026 is a year in which that omission is easier to spot.
The recurring conversion factor errors
Almost none of these are exotic. They cluster around a handful of traps, and each has a one-line fix.
| Mistake | Why it is wrong | Fix |
|---|---|---|
| Wrong year-set | A fresh set each year; in 2026 the wrong one misstates electricity by about a quarter | Match the set to the reporting period, not the submission date |
| Reading −26% as your own achievement | Two years of grid change plus a methodology revision, not one year of your action | Footnote the factor set and the break wherever you show a trend |
| Net CV against a gross-basis bill | UK gas is billed on gross; the net figure gives a different answer and nothing warns you | Match the basis the data arrived in |
| Blending Scope 2 methods | Location-based and market-based answer different questions | Report both, on their own terms, side by side |
| Double-counting electricity | Generation, T&D and WTT are three emissions, not three versions of one | Take generation once, then add T&D and WTT as Scope 3 |
| Ingesting the 11 June flat file | Some values published as zero until the 31 July reissue | Re-ingest the July version and re-run anything derived from it |
| UK grid factor on overseas consumption | DESNZ publishes UK factors only, and the UK grid is now unusually clean | Use each market’s own grid factor |
The value-chain side of the calculation follows the same matching discipline, with harder data to obtain. Our guide to Scope 3 emissions reporting covers business travel, purchased goods and the rest of the value chain.
The 2026 factors are correct, free and well documented. What changed is not their quality but their comparability — and the whole of the practical difficulty this year sits in saying clearly which set produced which number.
How the factors feed SECR, UK SRS S2 and CDP
The conversion factors are not an end in themselves. They are the input that makes every UK carbon reporting framework work.
SECR
Under SECR, qualifying companies report energy use and the resulting greenhouse gas emissions in the Directors’ Report, and the DESNZ factors are the standard tool for that conversion. SI 2018/1155
The Environmental Reporting Guidelines frame the required content: energy use, emissions, an intensity ratio, the methodology used, and energy-efficiency action taken. Environmental Reporting Guidelines
The methodology line is where the 2026 factor set gets named — see our SECR reporting template and the wider SECR carbon reporting guide.
UK SRS S2
Under UK SRS S2, in-scope companies report gross Scope 1, Scope 2 and Scope 3 emissions measured in line with the GHG Protocol Corporate Standard. GHG Protocol Corporate Standard
The DESNZ factors are a recognised input to that calculation, so one factor source serves both the established SECR regime and the emerging UK SRS S2 one.
S2 itself requires only location-based Scope 2; market-based reporting is permitted, not required, under the Standard (\u00b6\u00b629(a)(v), B30\u2013B31) — though the GHG Protocol Scope 2 Guidance above still expects dual reporting for entities in contractual-instrument markets like the UK.
CDP
The same factor choice surfaces in CDP’s questionnaire, where using the correct year-set on verified Scope 1 and 2 data is one of the clearest signals of a credible response — see our CDP scores and scoring methodology page.
The 2026 methodology change applies identically across all three. There is no regime in which the electricity factor did something different.
Downloading the official 2026 dataset
There is one authoritative home for these figures, and it is not a third-party summary — including this one.
Everything on this page is a reading of DESNZ’s own documents, and where a figure matters you should take it from the workbook rather than from anyone’s write-up.
Start with the major changes report if you already know the dataset: it is eighteen pages and it lists every movement with its cause.
Start with the full set and its Introduction worksheet if you are new, because that is where the withdrawn condensed set’s guidance now lives.
Bookmark the collection rather than a single year’s publication page, so the 2027 set appears where you are already looking.
What to take away
UK electricity went 0.17700 → 0.13096 kgCO2e/kWh. Quote the pair, not just the percentage.
The fall is mostly real decarbonisation — roughly 19 of the 26 points. Methodology is 6 to 7.
It spans two years of grid change, because the data lag was cut from two years to one.
No factor set uses 2024 data. Appendix 2 of the methodology report has a consistent back-cast series if you need to cross the gap.
The condensed set no longer exists. Anything telling you to download it is describing the 2025 release.
The flat file was reissued on 31 July 2026 to fix values published as zero. Re-ingest if you loaded it earlier.
Use the factor set for the reporting period, never the submission year. In 2026 that is a 26% error.
Whatever else you do, name the factor set each year used. It removes the entire ambiguity for one line of text.
UK emissions factors: frequently asked questions
What changed in the 2026 UK GHG conversion factors?
DESNZ published the 2026 conversion factors on 11 June 2026.
The headline change is the UK electricity factor, which fell from 0.17700 to 0.13096 kgCO2e per kWh, about 26%.
DESNZ’s own decomposition attributes roughly 16 percentage points to grid mix changes between 2023 and 2024, 3 points to the extra year of data from 2024 to 2025, and 6 to 7 points to methodological changes, improvements and corrections.
Transmission and distribution losses fell about 30%, and derived factors including rail, electric vehicles and homeworking moved with them.
Three other things changed: the condensed set was withdrawn, the flat file was reissued on 31 July 2026 to correct values published as zero, and the data lag was cut from two years to one — which skipped the 2024 data year entirely. Major changes report 2026
Who publishes the UK greenhouse gas conversion factors?
They are published annually by the Department for Energy Security and Net Zero.
They were badged under DEFRA historically and then BEIS, which is why they are still widely called the DEFRA factors.
They are compiled by Aether Ltd under the National Atmospheric Emissions Inventory contract, subcontracted from Ricardo, now part of WSP.
They are free, published under the Open Government Licence, and underpin Streamlined Energy and Carbon Reporting. GOV.UK collection
Which year of conversion factors should I use?
Use the factors for the year your reporting period falls in, not the year you compile or submit the report.
A 2026 reporting year uses the 2026 factors even if the report is written in 2027.
A new set is published each year and every set back to 2002 stays available in the GOV.UK collection, so a prior year can be reported on its own factors.
This matters more in 2026 than usual: applying the 2026 set to a 2025 reporting year understates electricity emissions by about 26%. GOV.UK collection
What is the difference between location-based and market-based Scope 2?
The location-based method uses the average emissions intensity of the grid where the electricity is consumed — for UK consumption, the DESNZ grid-average factor, 0.13096 kgCO2e per kWh in the 2026 set.
The market-based method reflects the electricity a company has contractually chosen, using factors derived from contractual instruments such as renewable supply contracts or REGO-backed tariffs.
DESNZ does not publish a market-based factor; those come from your supplier or a residual-mix publication.
The GHG Protocol Scope 2 Guidance requires companies in markets that offer contractual instruments to report both figures. This is dual reporting, and the UK is such a market. Scope 2 Guidance
Can I compare my 2026 electricity emissions with 2025 using the new factors?
Not without a caveat, and the caveat is more specific than “the methodology changed”.
The 2025 set was built on 2023 data and the 2026 set on 2025 data, so the published change contains two years of grid movement rather than one, plus 6 to 7 percentage points of methodological revision.
No published set uses 2024 data at all.
If you need a defensible comparison across that gap, Appendix 2 of the 2026 methodology report publishes a recalculated time series computed consistently for every year.
Whether to restate prior years is your decision, taken by reference to your reporting standard — DESNZ says so explicitly rather than directing either way. Methodology report 2026
How do the conversion factors relate to SECR and UK SRS?
SECR requires qualifying companies to report energy use and the resulting greenhouse gas emissions, and the DESNZ factors are the standard tool for that conversion.
UK SRS S2, the UK climate disclosure standard, requires gross Scope 1, Scope 2 and Scope 3 emissions measured in line with the GHG Protocol Corporate Standard.
The DESNZ factors are a recognised input for that calculation, so the same factor set supports both the existing SECR regime and UK SRS S2 reporting.
UK SRS S2 itself requires only location-based Scope 2, and treats market-based reporting as permitted rather than required. The GHG Protocol Scope 2 Guidance is the source of the dual-reporting expectation, and an entity can comply with UK SRS S2 on a single location-based figure. GHG Protocol Corporate Standard
Is there still a condensed set of DEFRA conversion factors?
No. The condensed set was published every year until 2025 and was not published in 2026.
The 2026 methodology report states that as of 2026 the condensed set is no longer published, and retains some legacy tables so that users can still find values from previous publication years.
The full set has been relabelled from “for advanced users” to “for all users”, and new users are now directed to its Introduction worksheet.
DESNZ has not published a reason for the withdrawal. Methodology report 2026
What is the 2026 UK electricity emission factor?
The UK grid-average electricity generation factor in the 2026 set is 0.13096 kgCO2e per kWh.
That is the figure to use for location-based Scope 2 on UK consumption in a 2026 reporting year.
Transmission and distribution losses are a further 0.01299 kgCO2e per kWh and belong in Scope 3, giving 0.14395 for electricity consumed including losses.
Well-to-tank factors are separate again, and also Scope 3. Methodology report 2026
When will the 2027 DEFRA conversion factors be published?
DESNZ states that the next publication is expected in June 2027.
No specific release date is announced in advance. The Code of Practice statement says the factors are regularly published in the first half of June.
The recent record is 10 June 2025 and 11 June 2026, with July 2024 the exception.
You can subscribe to update notifications on the GOV.UK publication page, which is also where any mid-year corrections are recorded — as the 31 July 2026 flat-file reissue was. Code of Practice statement
Are DEFRA emission factors the same as DEFRA’s spend-based multipliers?
No, and DESNZ flags the distinction on the publication page itself because it is a recurring source of confusion.
The conversion factors are activity-based: kilowatt-hours, litres, kilometres.
DEFRA separately publishes spend-based emissions multipliers alongside the UK and England carbon footprint statistics, expressed per pound spent by category.
Spend-based methods are a reasonable first approximation where activity data does not exist, particularly for supply-chain emissions, but the two datasets are not interchangeable and any inventory should state which method each line used. UK carbon footprint
Terms used on this page
- Conversion factor
- A published multiplier that turns a unit of activity into kilograms or tonnes of CO2 equivalent.
- Activity data
- The measured quantity being converted — kWh, litres, km, tonne.km — taken from meters, invoices and records.
- Location-based Scope 2
- Purchased electricity valued at the average intensity of the grid it came from.
- Market-based Scope 2
- Purchased electricity valued at the intensity of the contracts you actually hold.
- T&D losses
- Electricity lost in transmission and distribution between generation and your meter. Scope 3, not Scope 2.
- Well-to-tank (WTT)
- Upstream emissions from extracting, refining and delivering a fuel before it is burned. Scope 3.
- Gross and net calorific value
- Two conventions for stating the energy content of a fuel. UK gas bills use gross.
- Data year
- The year of underlying energy statistics a factor is built on, as distinct from the publication year printed on the file.
- GWP
- Global warming potential — the multiplier converting a non-CO2 gas into CO2 equivalent. DESNZ uses IPCC AR5 values.
- Flat file
- The machine-readable version of the factor set, one row per factor, for loading into carbon accounting software.
Primary sources
Every figure on this page is linked to the document it comes from.
Where a number could be taken from more than one table, the table is named.
- DESNZ — Greenhouse gas reporting: conversion factors 2026. Published 11 June 2026, flat file reissued 31 July 2026. The full set, the flat file, the 152-page methodology report, the 18-page major changes report and the Code of Practice statement all sit here.
- DESNZ — Statement of voluntary compliance with the Code of Practice for Statistics. Authorship, governance, the steering group cadence and the absence of a pre-announced release date.
- GOV.UK — UK government conversion factors for company reporting. The annual collection, every year-set from 2002 to 2026.
- DESNZ — Conversion factors 2025. The prior set, and the last one to include a condensed version.
- DESNZ — Environmental Reporting Guidelines, including SECR requirements. How the factors are applied under SECR.
- The Companies (Directors’ Report) and Limited Liability Partnerships (Energy and Carbon Report) Regulations 2018. The statutory instrument that created SECR.
- GHG Protocol — Scope 2 Guidance. Defines location-based and market-based methods and the dual-reporting requirement.
- GHG Protocol — A Corporate Accounting and Reporting Standard. Defines gross Scope 1, 2 and 3 accounting, the basis UK SRS S2 and SECR both measure against, and the base-year recalculation policy that governs restatement.
- DEFRA — UK and England carbon footprint. The separate spend-based emissions multipliers, published by DEFRA and frequently confused with these factors.
- National Atmospheric Emissions Inventory. The underlying UK greenhouse gas inventory the factors are derived from.
- DESNZ — Energy Trends. The statistical series that replaced the DUKES-plus-NAEI combination for electricity in 2026, and the reason the data lag could be cut to one year.
- DESNZ — DUKES Chapter 5: electricity. Generation mix and grid losses.
- DfT — Road freight statistics. The loading data behind the 2026 HGV factor movements.
- NESO — data portal. Live half-hourly GB carbon intensity, distinct from and not a substitute for the annual DESNZ factor.
- IEA — Emissions Factors. Grid factors for markets outside the UK, which DESNZ does not publish.
- IPCC — Sixth Assessment Report, Working Group I. The GWP values that sit in tension with the AR5 basis DESNZ uses.
- Open Government Licence v3.0. The licence the factors are published under.
Related reading
One line fixes most of this
Name the factor set each reporting year used, and the 2026 break stops being a problem and becomes a footnote.
Everything else on this page is detail underneath that sentence.
Every figure on this page carries an inline citation to DESNZ’s own published documents.
hello@uksrs.org.uk · Fractional Quest Ltd · Company No. 17322105 · 71–75 Shelton Street, London WC2H 9JQ · © 2026 Fractional Quest Ltd